DFFS with Python
About the project
![]()
![]()
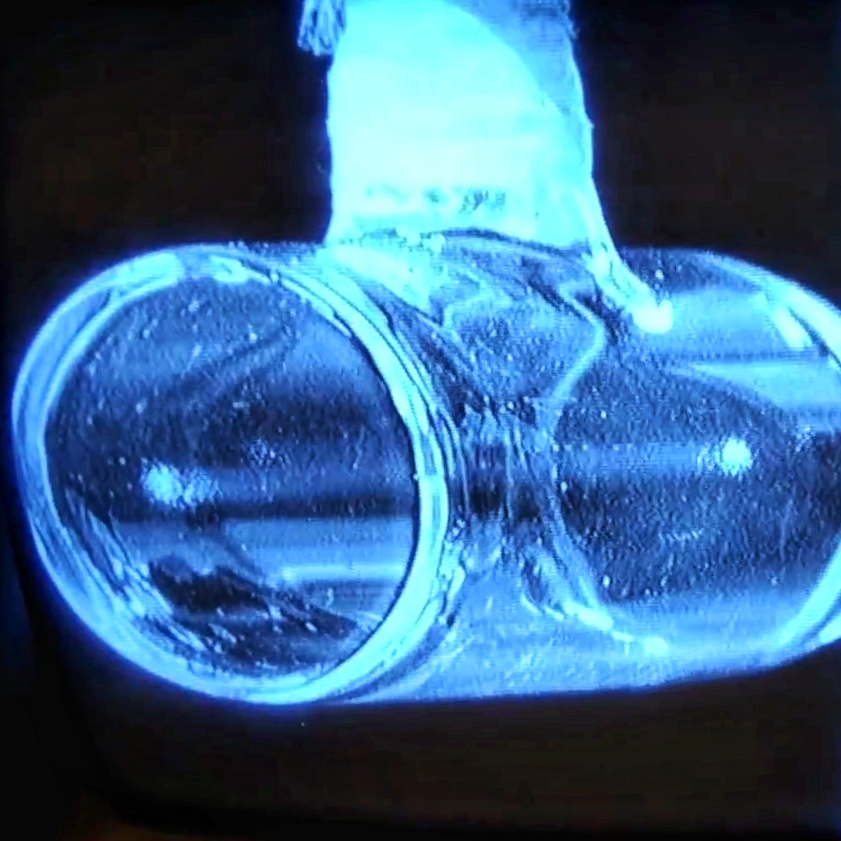
This repository contains Python code for analyzing data from a real-world quantum mechanics lab experiment. The experiment involved using laser pulses to excite Rubidium atoms in a vapor cell, aiming to uncover key features of the atomic structure.
Link to the project files: github.com/Al-1n/DFFS
Full scientific report: Doppler Free Saturation Spectroscopy of Rubidium
Requirements
- JupyterLab
- Pandas
- NumPy
- Lmfit
- Matplotlib
How to use this project
The code in these files can be adapted and used as a reference for analyzing results of laser absorption spectroscopy experiments.
Any environment that can load a python kernel and run jupyter notebooks such as vs code, google collab or conda can be used.
In order to adapt the code to new measurements, a basic understanding on how to place, load and transform the data is required.
Contributors
The experiment was performed under the guidance of Dr. Eric Jones and Kristina Finelli.
Data collection and analysis performed by Zachary Kluger and Alin Airinei.
Background
Rubidium(Rb) is part of the alkali metals and has atomic number 37. Alkali elements are characterized by a closed shell configuration of the inner electrons and a single valence electron which gives them a ”hydrogen-like” structure and properties.

The quantization of angular momentum has important implications for the energy levels of the hydrogen atom. For example, the energy levels of the hydrogen atom are split into multiple sublevels due to the different possible values of the electron’s orbital angular momentum and spin angular momentum. This splitting of the energy levels is known as the fine structure of the hydrogen atom.
To detect the fine and hyperfine splitting of energy levels, we can use a spectrometer to measure the wavelength or frequency of electromagnetic radiation produced during transitions between energy levels.

When an atom or molecule absorbs a photon of energy, it can be excited to a higher energy level. When the atom or molecule decays back to a lower energy level, it emits a photon of energy. The wavelength or frequency of the emitted photon is characteristic to the energy difference between the two energy levels.
However, due to the fine and hyperfine splitting of the energy levels, the emitted photon can have multiple wavelengths.
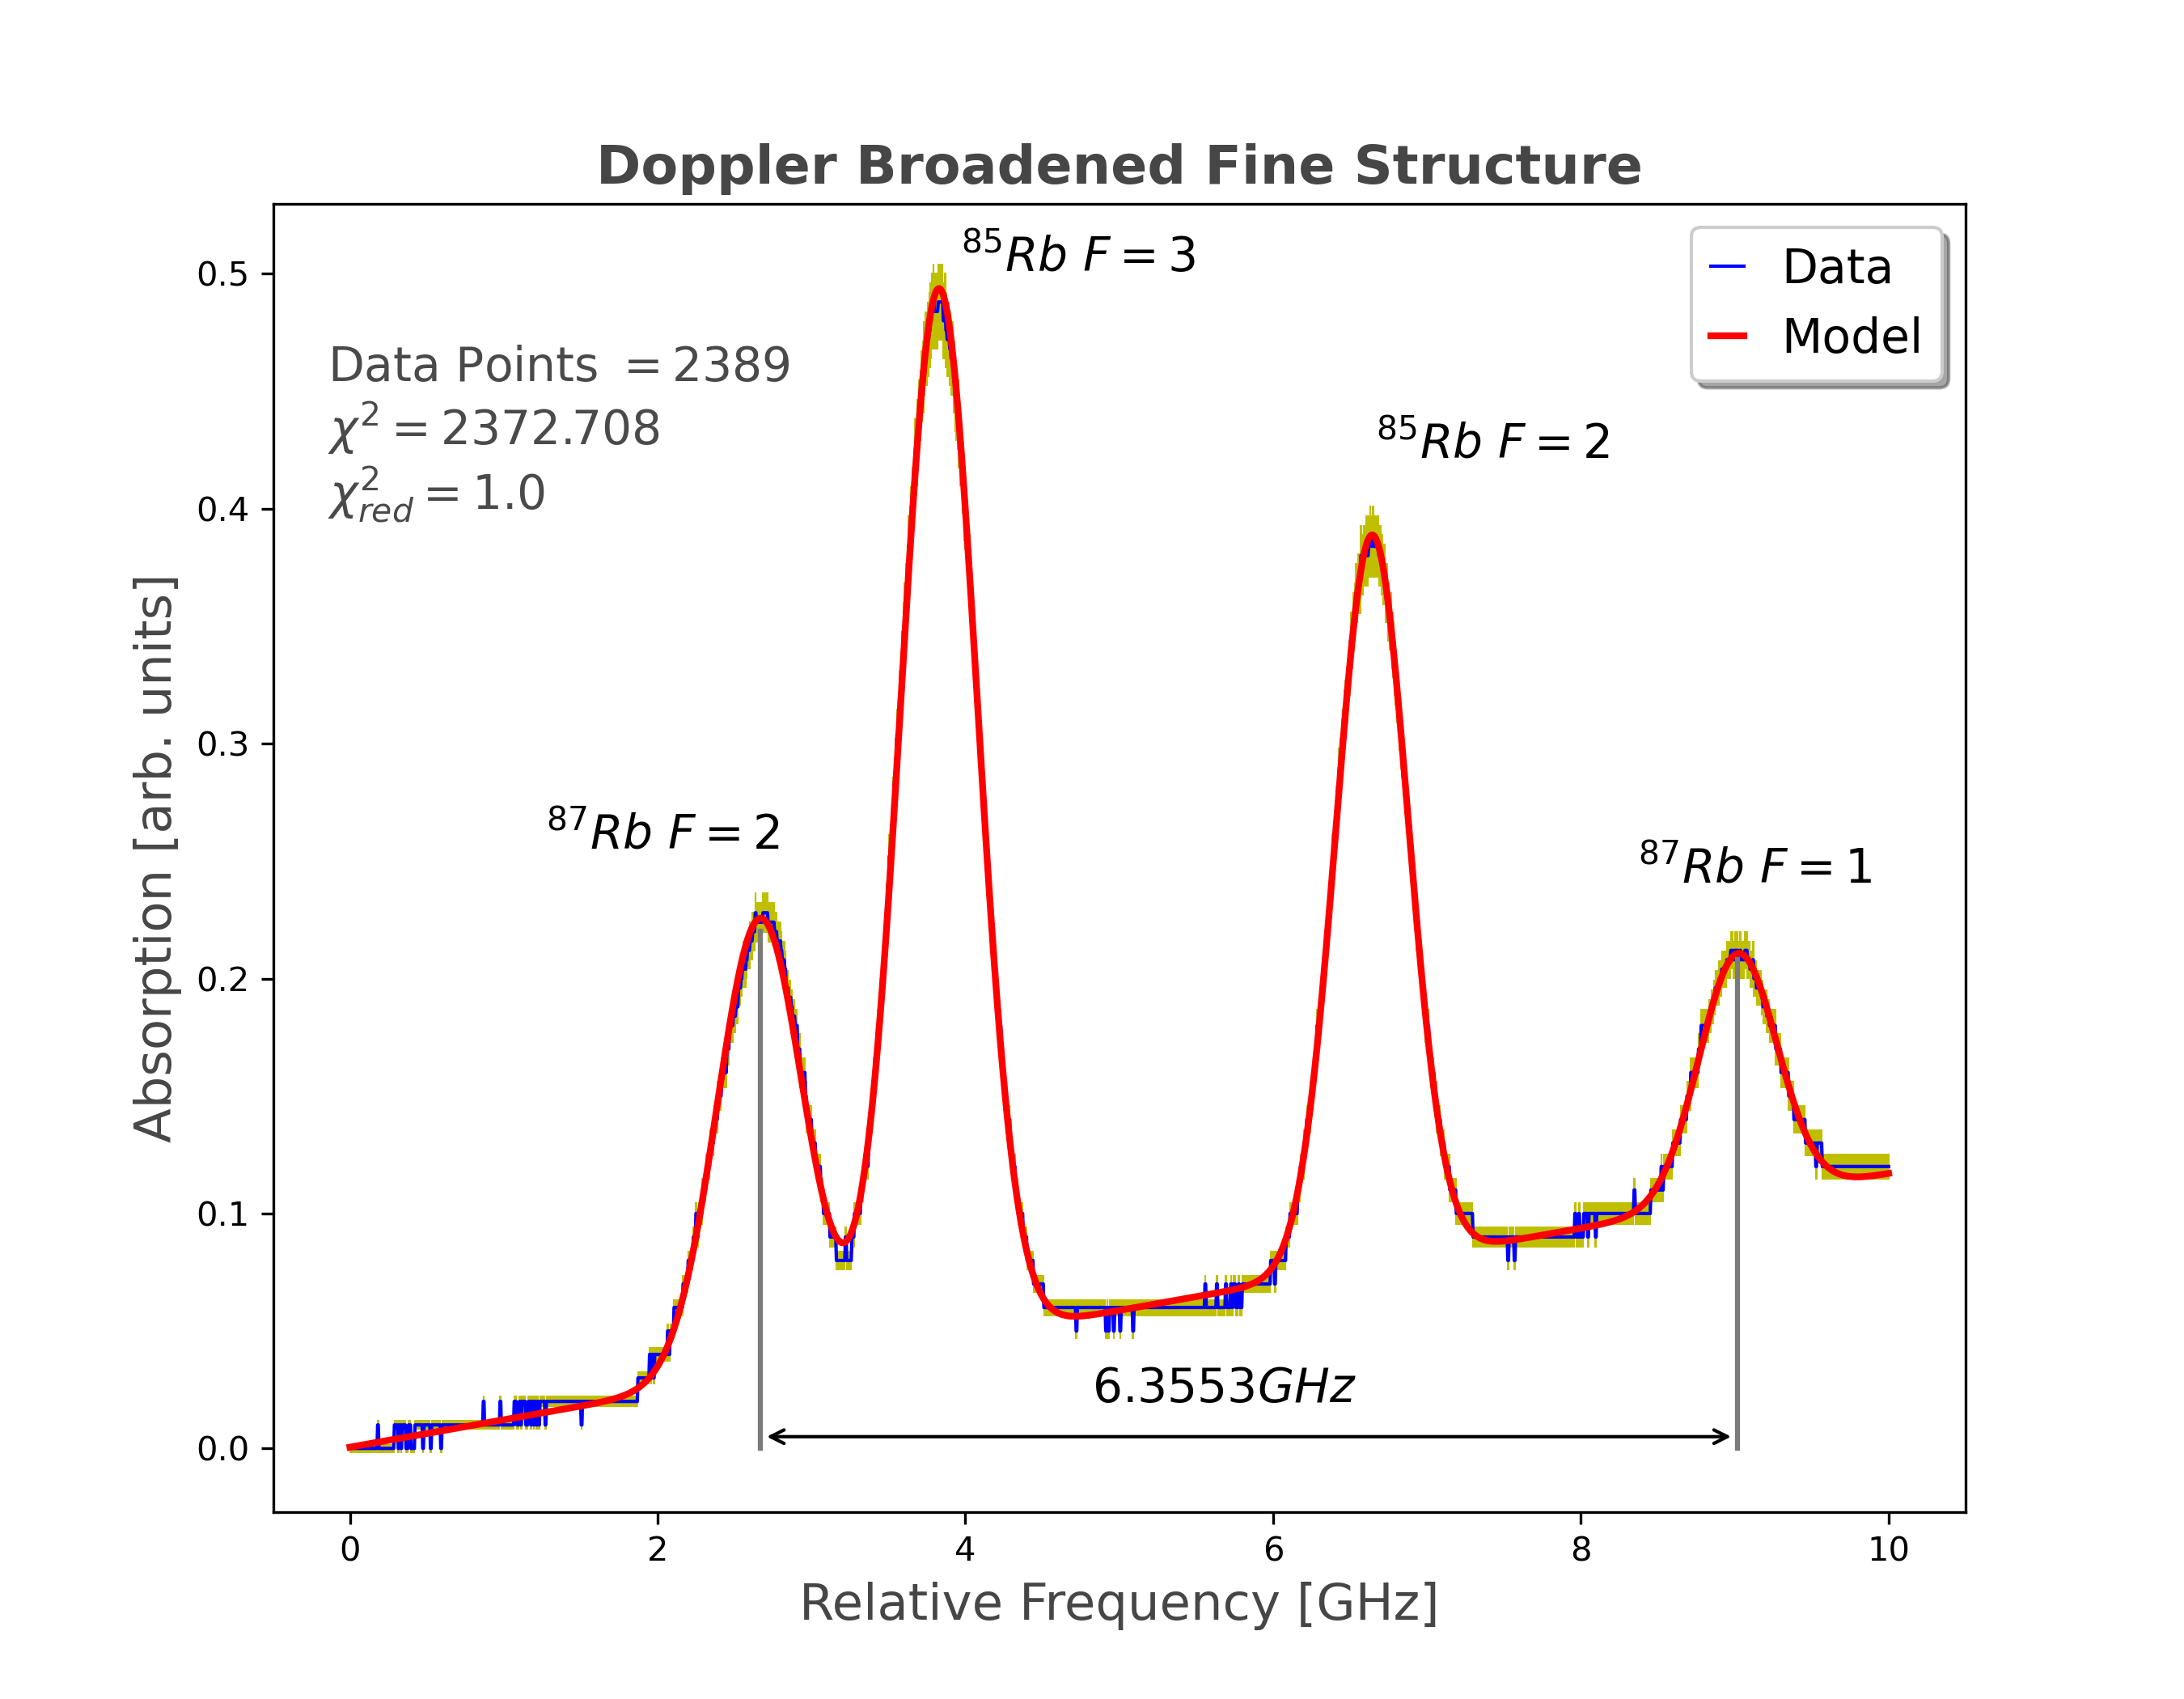
Using a spectrometer we can measure the intensity of the photons at each wavelength. The resulting spectrum will have peaks corresponding to each wavelength. First, the fine structure can be analyzed by locating and measuring the distance between peaks. Next, by applying a counter-propagating laser beam to reduce the absorption rate of the initial probe, the hyperfine structure will be revealed by the appearance of dips corresponding to transitions from the ground state to the hyperfine levels of the excited state.
